
Resource Cards
![]()
![]()
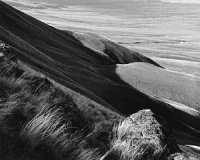
The topography of the lower Columbia Basin includes canyons, hills, and valleys.
What is topography?
The topography of the lower Columbia Basin includes canyons, hills, and valleys. Topography is a three-dimensional representation of the Earth's surface on a two- dimensional surface (paper) as seen from overhead looking directly down. Topographic maps have contour lines that show topographic features such as canyons, mountains, plains, and plateaus. Topographic maps of the Tri-Cities area show such features as Red Mountain, Zintel Canyon, Iowa Flats, and the Rattlesnake Hills. Elevations and the shape of the terrain are shown by the contour lines. Roads, towns, mines, benchmarks, water, types of vegetation, along with many other features also are included on topographic maps using map symbols and colors. Topographic maps are often nicknamed "topo maps" for short. The U.S. Geological Survey has been making topographic maps since 1882 and has completed maps for the entire country. These maps are in feet and miles, but new maps are being produced using metric measurements.
How are the scales on a topographic map interpreted?
Scales are represented as ratios such as 1:24 000 to 1:500 000, where the larger the denominator the smaller the scale. For example, on a 1:24 000-scale map, each inch represents 24,000 inches or 2000 feet. On a 1:316 800-scale map, each inch represents 316,800 inches or 5 miles. A 1:24 000-scale map provides more detail with its larger scale. Topographic maps generally cover an area bounded by 7.5 minutes of latitude and 7.5 minutes of longitude (about 160 square kilometers), and are known as 7.5-minute quadrangle maps.
What do contour lines on topography maps represent?
If you look at a topographic map, the solid, curving lines are contour lines that indicate the elevation and shape of terrain. The elevation change between any two adjacent countour lines (the contour interval) is the same everywhere on a given map. If the contour interval is 10 feet, the elevation changes 10 feet within these adjacent lines. Contour lines close together indicate steep mountainsides or cliffs. Gentle sloping hills or flat plains have contours farther apart from each other. Experienced map readers can look at the contours and visualize the three-dimensional shape of the land. "Cutting" a line through the contours enables the map reader to draw a profile of that section of the mountain or plateau. Hachure marks along a contour show depressions, for example, of a crater or the mouth of a volcano.
Who uses topography maps?
Hikers, campers, snow skiers, city and county planners, the Fish and Wildlife Service, Forest Service, miners, loggers, highway planners and construction workers, travelers, surveyors, geologists, engineers, and scientists are just a few of the people who use topographic maps. Knowing the shape of the terrain enables a hiker to plan a hike. Highway planners determine the best routes for highways knowing the cut and fill areas. Surveyors locate benchmarks, and geologists locate their actual positions relative to the map and can determine if changes to the land have occurred.
![]() "Science is constructed of facts as a house is of stones. But a collection of facts is no more a science than a heap of stones is a house." Henri Poincare
"Science is constructed of facts as a house is of stones. But a collection of facts is no more a science than a heap of stones is a house." Henri Poincare
Keep in mind this fact sheet is intended to be used only as background information to support your effort to encourage inquiry-based science, which parallels the way scientists uncover knowledge and solve problems.
![]()
1. See how many objects and places you can find on a topographic map.
Obtain topographic maps of your local area (see sources below): Richland, Kennewick, Benton City, Columbia Point, Badger Mountain, and Pasco 7.5-minute series quadrangle maps are a good start for the Columbia Basin. Have students take turns looking at the map and have them list all they can find on the map. This exercise will introduce the students to the maps in general. Pass out the USGS Topographic Map Symbols leaflet and have students search again with more knowledge of what the symbols represent. Students will enjoy locating where their home is on the 1:24 000-scale map. Challenge them to transfer this knowledge to the 1:100 000-scale Richland Quadrangle map. Post the map in the classroom, and use flag pins labeled with their names.
2. Build a local mountain.
Here's how: Enlarge Red, Candy, and Badger mountains from the 1:100 000-scale Richland Quadrangle map. Outline the 100-foot contour intervals, and use this for the student's pattern. Draw a radius line through the contours to be used as a guide to match up the layers of elevations correctly once they are all cut out. Students will cut along the lowest contour, say 200 feet. Place the pattern on cardboard, trace and label the cardboard with the elevation and the position marker. Now cut the pattern along the next contour line at 300 feet. Trace and label as before. Continue for all contour lines. Cut out the cardboard elevations, and assemble, matching the position markers. Place clay balls or additional small pieces of cardboard to separate the layers about 1 centimeter apart. When completed, the students discover how the two-dimensional map actually represents a three-dimensional terrain. Extensions: Have students paper mache their models. Produce a profile through a section of their mountain. Students could also create their own topography maps using the Topographic Map Symbols, guide. These maps can be shared with other students to see if they can draw and visualize the student's terrain. Create a topographic map of the school grounds.
Questions a scientist might ask. How has the terrain changed from past maps? Where am I standing relative to this map? What caused these topographic features? What are the contour intervals? What scale map meets my needs? What historical or archaeological features are noted on this map?
![]()
- Full Option Science System (FOSS), Lawrence Hall of Science, University of California, Berkeley, California. Landforms; Build A Mountain & Bird's Eye View (Grades 5-6).
- How to Teach with Topographic Maps, 1998. Dana Van Burgh, Elizabeth Lyons and Marcy Boyington, National Science Teachers Association, Arlington, Virginia.
- The Practical Geologist, 1992. Dougal Dixon, Simon and Schuster, London.
- U.S. Geological Survey, Map Scales, Factsheet,, October 1993. (USGS map supplier: Spokane Earth Science Information Center (ESIC); 509-368-3130 or call 1-888-ASK-USGS.)
![]()
- Discovering Topography -http://www.seismo.berkeley.edu/seismo/istat/9th/topography.html
- US Geological Survey, Earth Science Information Center -http://ask.usgs.gov/
- US Geological Survey, A Tapestry of Time and Terrain -http://tapestry.usgs.gov/Default.html
- U.S. State Topographic Maps -http://www.ngdc.noaa.gov/mgg/topo/state.html
![]()
Initial development and printing was funded by the Partnership for Arid Land Stewardship (PALS). Project Manager: Karen Wieda. Written by: Rebecca Moak, Christ the King School. Series Editor: Georganne O'Connor; Design: WinSome Design.
![]()