
Resource Cards
![]()
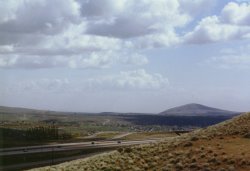
"Normally, few clouds exist in the Columbia Basin sky." Photo: Kathy Poston
![]()
Meteorology is the science of the atmosphere. The word meteorology comes from the Greek meteoros, which means lofty or elevated and logos, meaning discourse or description. The field of meteorology includes both weather and climate and is concerned with the physical, dynamical (a force producing change or motion), and chemical state of the Earth's atmosphere and interactions between the atmosphere and the Earth's surface. Humans' earliest observations of climate and weather date to hunters, gatherers, and farmers, who studied signs of changing weather in the sky. Today, scientists who study weather are called meteorologists.
Weather and climate are closely related, but big differences exist between them. Weather refers to the condition of the atmosphere at a given time and location. It describes daily local changes in temperature, humidity, wind, clouds, and precipitation (rain, snow). Climate, in contrast, describes the average of these conditions over a long period of time--month, year, or more (annual precipitation, monthly mean, high, and low temperatures) and variability.
What about the Columbia Basin's climate?
As you know, the climate of the Columbia Basin tends to be warm and dry. The Cascade Mountains to the west of the Basin greatly influence our climate by means of their "rain shadow" effect, which causes moisture (rain or snow) to be released from the clouds before they reach the area. This limits the amount of precipitation we receive each year. For example, the average rainfall in the lower Columbia Basin is 6 to 7 inches per year, which includes about 13 inches of snow (13 inches of snow equals about 1.5 inches of rain). Because the mountains significantly reduce the amount of moisture in the air, fewer clouds exist in the Columbia Basin, which means more sunshine and very warm temperatures from late spring through early autumn. The average annual temperature recorded at the Hanford Meteorology Station--located on the Hanford Site near Richland--is 53.3 degrees Fahrenheit. The warmest month is July, which averages 76.4 degrees Fahrenheit, while the coolest month is January, which averages 30.5 degrees Fahrenheit. The hottest temperature ever recorded at Hanford was 113 degrees Fahrenheit on August 4, 1961; the coldest was -23 degrees Fahrenheit on February 1 and 3, 1950.
How is wind created?
In the Columbia Basin, we are all familiar with wind, the kind that can whip up to 50 miles per hour, blowing dust from nearby fields, tumbling trees, and tearing roofs off buildings. But how is wind created? Scientists say it has to do with air pressure. If you have seen what happens to a tire if it's punctured or a balloon when you blow it up and then hold the neck and let the air come back out, you get an idea of this pressure. Air inside a tire or balloon is at high pressure, and air outside of the tire or balloon is at lower pressure. Air comes out of the high-pressure tire or balloon into the lower pressure air of its surroundings. A similar occurrence happens in the Earth's atmosphere. Air moves from regions of high pressure to regions of low pressure (though not in a straight line). This movement of air is what we know as wind. The greater the difference between high pressure and low pressure, the stronger the wind.
What are clouds, fog, rain, and snow?
Clouds are formed as air rises into the atmosphere. They are created by very tiny water droplets (it takes a million cloud droplets to make one raindrop). Scientists classify clouds by their shape and by their height (low, medium, and high). Stratus and cumulus are two kinds of low-level clouds. Altostratus and altocumulus are medium-level clouds, and cirrus and cirrostratus are high-level clouds.
Fog is a stratus-type cloud that reaches the ground. As cloud droplets grow, they become heavy and eventually may become so heavy they fall to the ground as rain. In parts of the world where air temperatures are cold enough, water droplets in the clouds freeze into ice crystals and join together into snowflakes. When the snowflakes become big and heavy enough they fall from the clouds--and if the air near the ground remains cold enough (usually near or below freezing) they remain as snowflakes. If the air above and near the ground is too warm, they melt and fall as rain.
What do meteorologists do?
To become a meteorologist you must go to college and take courses in mathematics, physics, chemistry, and many different courses in meteorology or atmospheric sciences. Meteorologists may have a variety of different jobs. Some meteorologists that many people call "weathermen" may study day-to-day weather events and provide forecasts for the public. Other meteorologists may fly in research aircraft to study clouds, rain, or hurricanes. Meteorologists conducting tornado research may use cars and trucks to try to "chase" these violent storms so they can understand them and provide better forecasts to save lives. Some meteorologists also work mainly in offices with computers. They develop computer models to try to better understand the Earth's atmosphere. Others, primarily interested in research, may work in colleges and universities or in government or private laboratories. Those involved in weather forecasting may work for the government (such as the National Weather Service) or for private weather companies or television/radio stations.
![]() "Science is constructed of facts as a house is of stones. But a collection of facts is no more a science than a heap of stones is a house."- Henri Poincare
"Science is constructed of facts as a house is of stones. But a collection of facts is no more a science than a heap of stones is a house."- Henri Poincare
Keep in mind this fact sheet is intended to be used only as background information to support your effort to encourage inquiry-based science, which parallels the way scientists uncover knowledge and solve problems.
![]()
1. You can have fun determining the monthly average(s) for your community.
Were you surprised to read that the average temperature at the Hanford Meteorology Station in July was 76.4 degrees Fahrenheit and 30 degrees Fahrenheit in January? Did you think the average temperature would be higher for our area? Lower?
Here's How: You will need a calendar, pencil, calculator, and access to the local newspaper. Each day check the paper for high and low temperature from the previous day.
Record both the high and low temperatures on your calendar.
At the end of the month, add all the high temperatures for your community and divide by the number of days in the month. Do the same for the low temperatures.
What is the average high? Low?
If you track the weather for a year then you can compute a 1-year average (which describes the climate of your community). What was the maximum temperature for the month? For the year? The minimum temperature for the month? For the year? How much hotter than the average was the hottest day? The coolest night? Ask a friend or relative in another city to keep same data on the temperatures in their community. How do the temperatures they record differ from yours? What are some of factors that might influence the temperature?
2. Do you know about weather in other areas of the world?
You will need a local newspaper, a world map, pencil, and paper that has a grid on it (see example below). Each member of your class or family should select a city from the map to track (make sure the city is one whose temperature and other aspects of weather are reported in your paper. As a group, decide how often you will check the temperature, precipitation, humidity, cloudiness, and windiness in the cities you have selected. Remember to record your data on the data sheet. If you are not familiar with the symbols used for the weather in the newspaper, check the key or talk to a teacher or your parent(s). Watch for news on weather phenomena in your city. Share what you have learned about your city at a weekly class or family meteorological meeting. How could this information help you plan a trip? Decide where to live? (Adapted from Nick Walker, The "Weather Dude" Seattle, Washington)
3. Did you ever wonder how the weather and climate impact plants and animals?
Pick a site in your backyard, or in a park that you can visit on a regular basis. Take along a notebook and sit quietly in the spot you picked. Record in your journal the date, time of day, and the weather (What is the temperature? Is it cloudy, windy, humid?). What animals do you see (insects, birds, fish, mammals)? What are they doing? Where do they go in winter? Can they be found in other habitats? If you can identify the birds, note their names in your notebook. If you don't know the types of birds you see quickly sketch the birds and note any special markings. Later look them up in a bird guide and add the names to your notebook. What plants do you see? Are shoots just starting to emerge from the ground? Are the leaves frostbitten? Visit your favorite spot throughout the year, in different kinds of weather and record your observations in your notebook. Weather and climate influence the life cycle of plants and animals but what other factors influence the plants and animals you observed? How would those plants and animals be affected if the climate changed?
![]()
- Cloudy with a Chance of Meatballs. 1982. Judith Barrett, Judi Barrett. Simon & Schuster. New York.
- Full Option Science System (FOSS), Encyclopedia Britannica Educational Corp. Chicago, Air and Weather Module, Grades K-2.
- How the Weather Works. Michael Allaby. 1995. Reader's Digest Association Incorporated. Pleasantville, New York.
- National Audubon Society Field Guide to North American Weather. 1991. David M. Ludlum, Alfred A. Knopf. New York.
- Nature Journaling. Clare Walker Leslie and Charles Roth. 1998. Storey Books. Pownal, Vermont.
- Puddle Jumpers: Fun Weather Projects for Kids. Jennifer Storey Gillis. 1996. Storey Books. Pownal, Vermont.
- Ranger Rick's NatureScope, Wild About Weather. National Wildlife Federation. Washington, D.C.
- Science and Technology for Children ( STC). Carolina Biological Supply Company. Burlington, North Carolina, Weather Unit - Grades K-2.
- Weather: Nature Company Discoveries Library. Time-Life Books. 1996. San Francisco, California.
- Weather, Brian Cosgrove. 1991. Eyewitness Books, Knopf. New York.
![]()
- The Hanford Meteorological Station: http://hms.pnl.gov
- The "Weather Dude": http://www.wxdude.com/
- EarthWatch – Weather on Demand: http://www.earthwatch.com/
- How the Weather Works - http://www.weatherworks.com/
- NOAA Weather Education - http://www.nws.noaa.gov/om/edures.shtml
- The Weather Network - http://www.theweathernetwork.com/
![]()
Initial development and printing was funded by the Partnership for Arid Lands Stewardship. Written by: Betty Walton, Columbia Basin College. Series Editor: Georganne O'Connor; Design: WinSome Design; Printing: Eagle Printing and Graphic Design. First Printing: June 1998.
![]()